 Books
Books Technology
 Electronics
 DC motors
 Raspberry Pi Controllers
 Relay
Relay Temperature sensors
 Analog sensors
 Digital sensors
 ADC
ADC Bluetooth
 Radio communication 2.4 GHz
 LCD-screen
 All tags
 Programming
 Web-interface
 Graphical interface
 Windowed Application
 Video
Video Images
 Audio
Audio Text
Text HTML
HTML Lof-files
 Neural networks
 Weaponry
 Projects
Gyroscopic dynamics measurement system for vehicle
System for measuring the dynamic characteristics of a car on a three-axis accelerometer/gyroscope.
The passive system does not require a connection to the car's on-board computer, it is enough to install it rigidly inside the cabin.
After turning on, the system begins to receive data on accelerations and turns in real-time, based on which it generates relative data on movement, turn, speed, and acceleration. Data is transferred to a PC via USB connection (COM-port emulation) and processed by a control application.
Further, the data is displayed in a graphical form with the ability to save the log, open previously taken measurements and calculate the dynamic characteristics
After turning on the system, the car performs maneuvers (acceleration, braking, etc.) during which data is recorded.
The period of time that the tester is interested in can be selected (either for the current measurement or after opening previously saved logs of earlier measurements). After that, based on the data on the movements, data on the dynamics of the car are calculated (distance traveled, speed, acceleration, engine speed, power, etc.)
Functions:
- Real-time 3-axis (-X, -Y, -Z) detection:
- turning
- acceleration
- Calculation of dynamic characteristics for a certain period of time (acceleration/deceleration of car)
- traveled distance
- real speed
- acceleration
- engine speed (based on predetermined gear ratio)
- power (based on predetermined weight of car)
- Graphical display of all measured and calculated values
- Saving logs and opening previously saved data
- Comparison between several test (same car or different cars)
Main system parameters:
- Range of angular rate sensors (X-, Y-, and Z-Axis) ±250, ±500, ±1000, ±2000°/sec
- Range of triple-axis accelerometer (X-, Y-, and Z-Axis) ±2g, ±4g, ±8g, ±16g
- Shock tolerant 10 000 g
- Connection from sensor to controller I2C bus
- Connection from to controller to PC USB (COM-port emulation)
Control Application features:
Desktop application to receive data form three-axis accelerometer/gyroscope. Can work on any PC with operating system supporting .NET framework (windows 7,10,11) The main window contains central panel, all values can be displayed in graphical form.
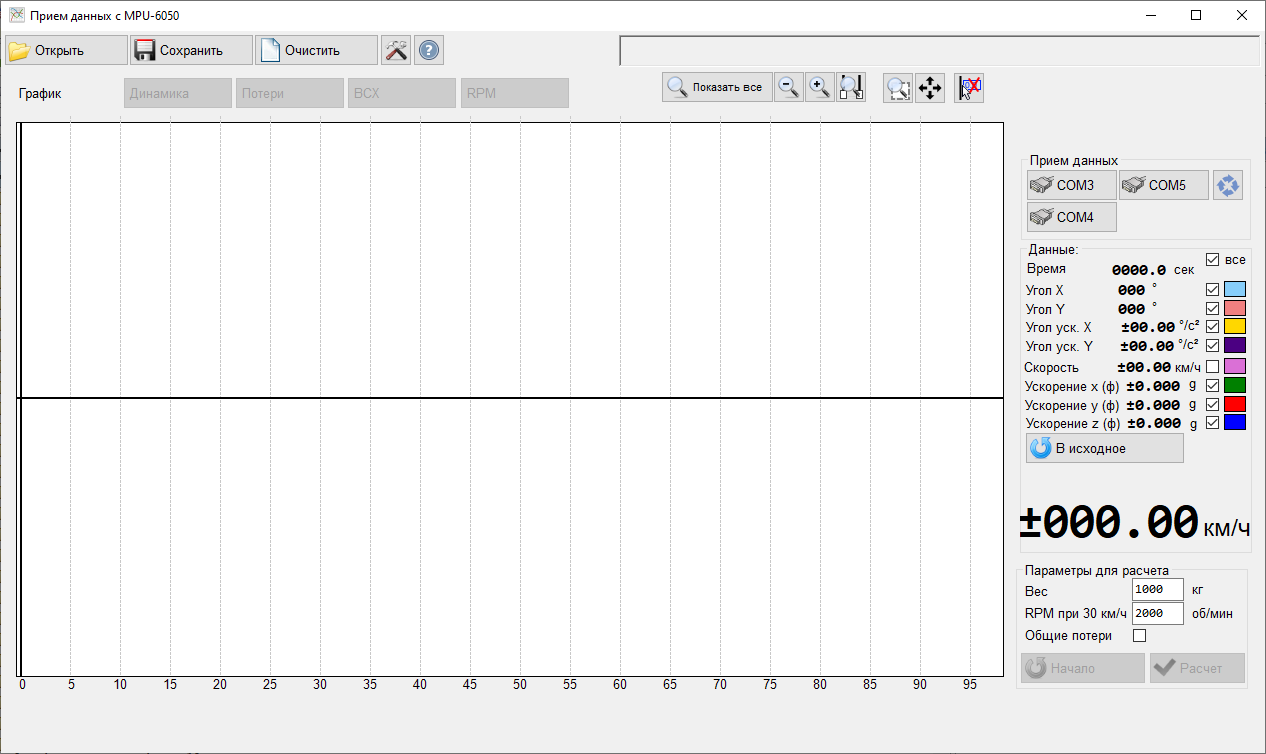
The buttons in the top row are used to zoom (you can also use the scroll wheel), reset the zoom (double click the middle mouse button), move the field of view on the chart (you can use the middle mouse button), show the slider with the current values. An independent setting of the line display style for each parameter can be applied using the panel on the right side of the window. Buttons on the top of graph panel are switching main work-modes and
- Graphical display of incoming data (angles, speeds, accelerations)
- Graphical display of dynamic data, calculated for a certain period of time (acceleration/deceleration)
- RPM chart calculated for a certain period of time (acceleration/deceleration)
The main menu includes buttons to save and open previously saved logs, system parameters, and a console with current commands sent to the controller and received responses. A separate panel is designed to select the port to which the controller will be connected.
Main functions of control application:
- Incoming data (“Chart”) mode Main mode by default. Indicate current values of sensor (when controller connected) or full graph (from previously opened logs). The display of any of the parameters can be disabled or configured independently (change the color and thickness of the line, the vertical scale)
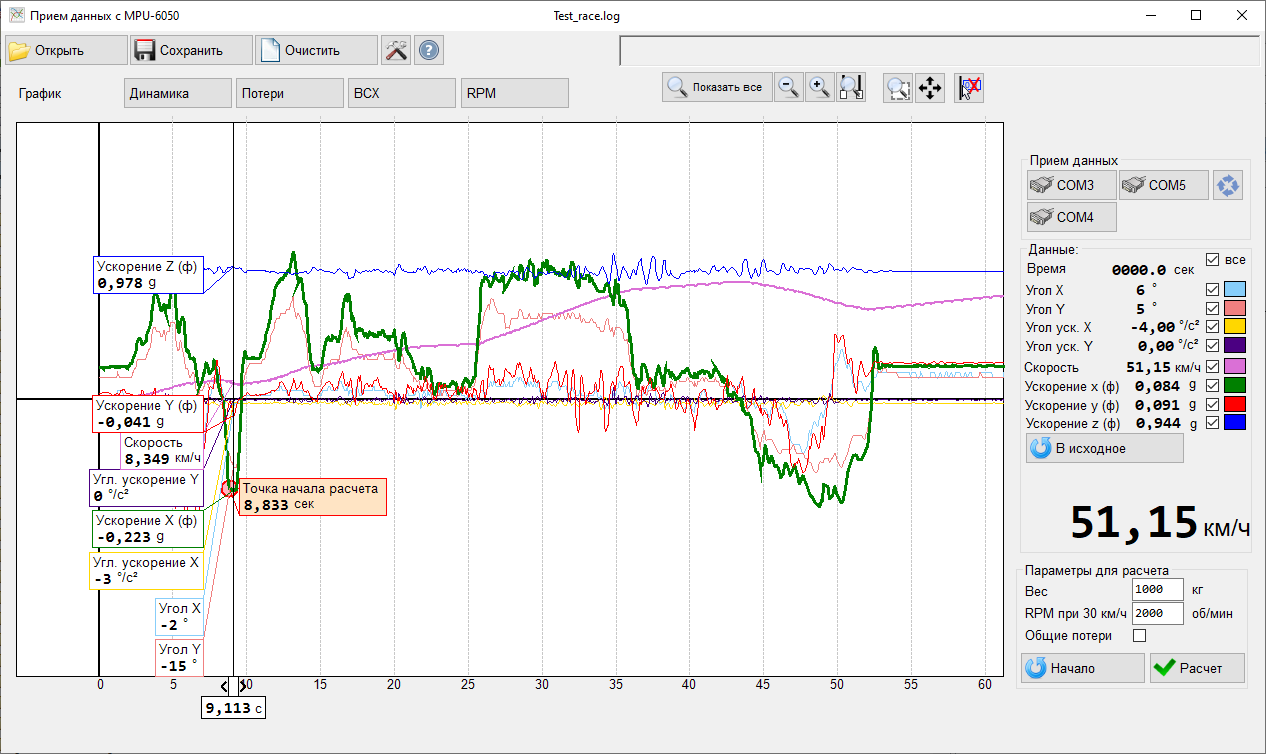
Graphical display of the following incoming data:
- Time (from start of test)
- Angle (-X, -Y)
- Angular acceleration (-X, -Y)
- Linear acceleration (-X, -Y, -Z)
- Speed Control elements:
- Button for rreturn to the original values (resets the parameters before the start of the race)
- Change approx. weight of car (used for power calculation)
- RPM for 30km/h (used for RPM calculation)
- Reset to “start” of race (The point in time is calculated from which the speed begins to increase (the estimated start of the race). Pressing again selects the next point of increasing speed). The starting point can also be selected manually by moving the appropriate slider on the graph.
- Calculate button starting calculation of dynamic characteristics based on previously selected “start” point.
- Dynamic data (“Dynamic”) mode: Activating after selecting test period (certain period of time while acceleration/deceleration were made)
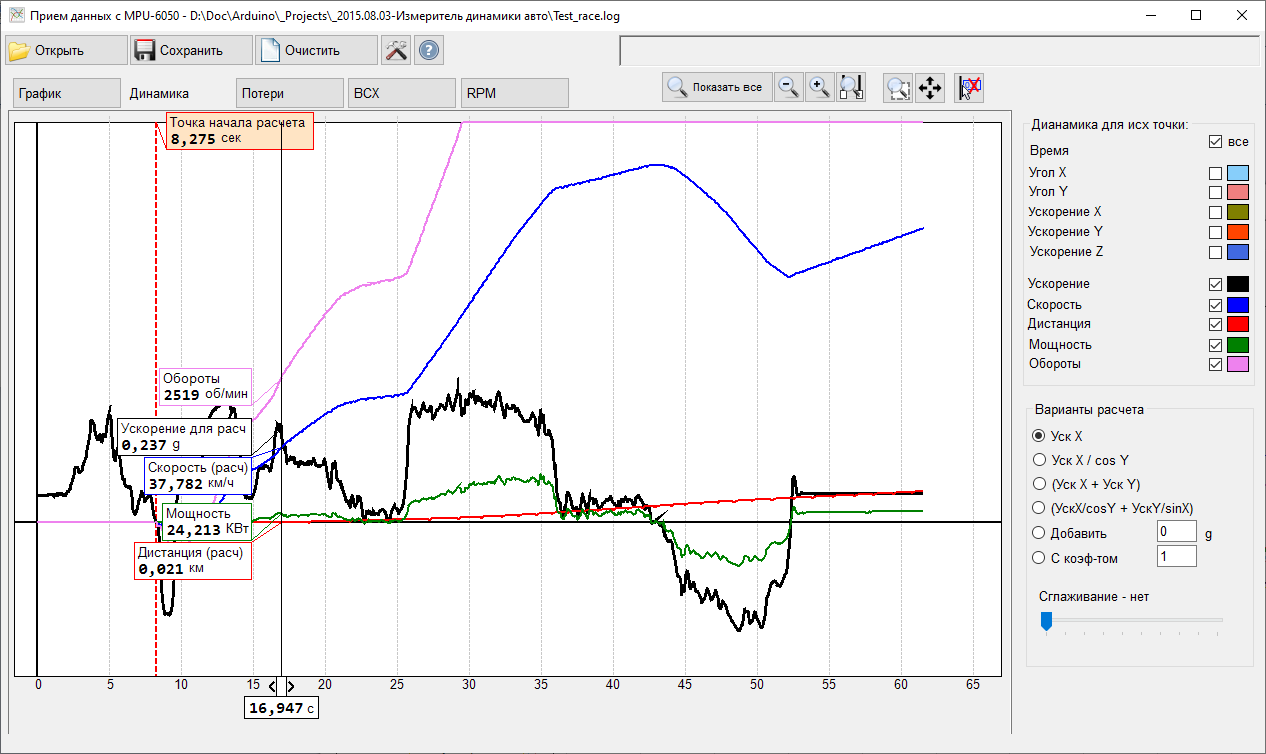
Graphical display of the following data:
- Angle (-X, -Y)
- Linear acceleration (-X, -Y, -Z)
- Acceleration
- Speed
- Distance
- Power (based on approx. weight of car, selected in previous mode)
- RPM (based on reference RPM corresponds to 30km/h, selected in previous mode) Control elements:
- Selection of different methods of acceleration calculation
- “AccelerationX” - movement direction exactly coincides with the main axis of the sensor -X
- “Acceleration X/cosY” - Acceleration along the X-axis with refinement of the angle of inclination of the sensor to the horizontal surface Y
- “AccelerationX + AccelerationY” – Acceleration is calculating as Sum of accelerations on both horizontal axes
- “AccelerationX/cosY + AccelerationY/sinX” – Acceleration is calculating as Sum of accelerations on both horizontal axes corrected for the angle to the horizontal plane
- Add XXX g With Coefficient XXX– Additional adjustment of the force of gravity (to reduce the effect of inaccurate placement of the sensor to the horizontal plane)- absolute and relative correction
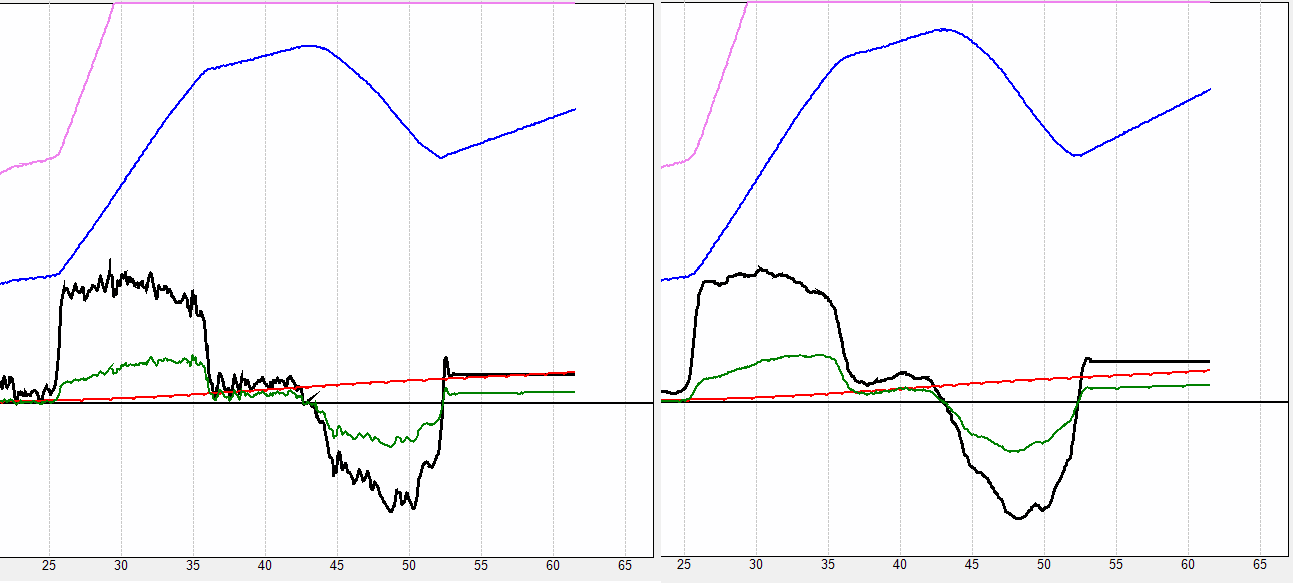
- Smoothing (slider) –changes the degree of smoothing of lines on graphs, which is achieved by averaging the last few values. Allows you to reduce the "noise" from fluctuating values, which does not affect the overall measurement accuracy. Example of different levels if smoothing for the same initial data:
- RPM mode: Indicating of motor RPM chart for the selected test run based on speed data and reference RPM (corresponds to 30km/h), selected in Main mode.
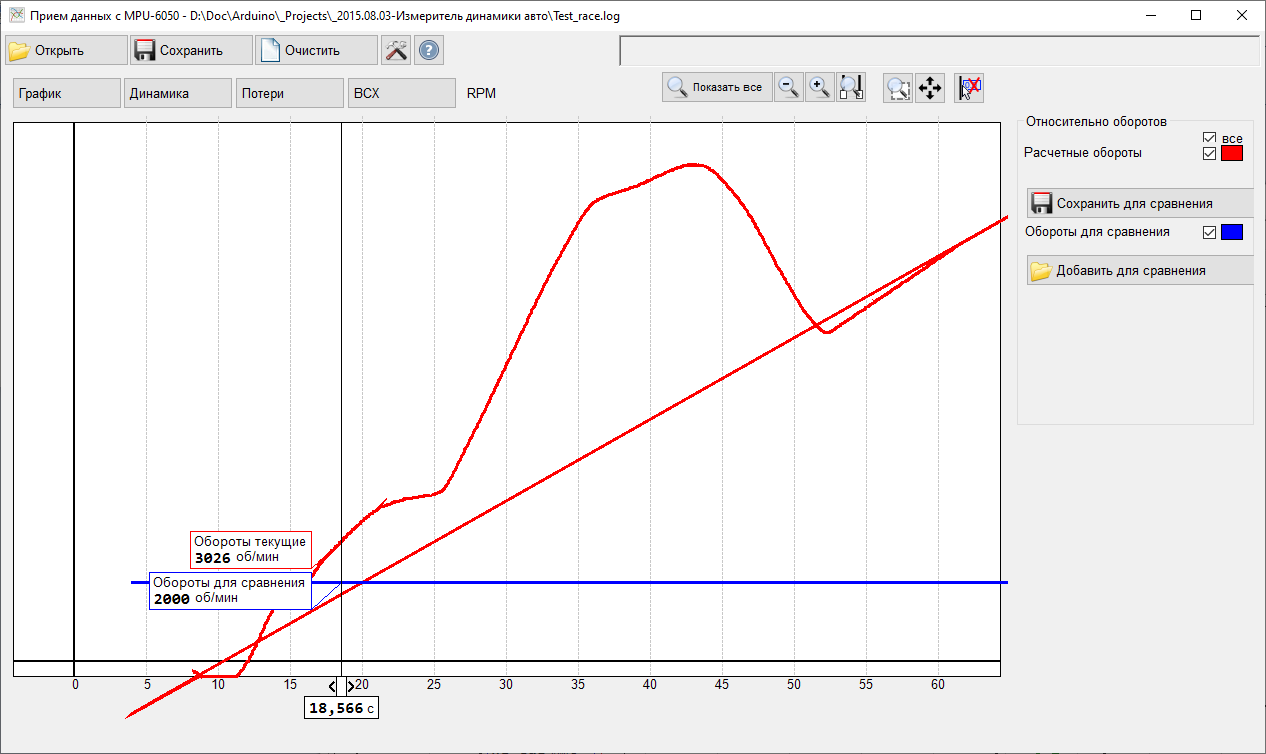
Graph can be saved separately from the underlying data Previously saved race logs can be opened by clicking on the "Add for comparison" button
Components
- Controller Arduino UNO
- MPU-6050 three-axis accelerometer/gyroscope
Possible further improvements
- Remote connection (via Bluetooth, IR or radio channel)
- Additional calculation based on raw-input
- Further improvements in the processing of signals from the sensor and a more accurate calculation of speeds and accelerations
- Adding a screen and individual controls connected directly to the controller for operation without connecting to a PC
- Saving and opening logs from SD-card
- Control program usability improvements