Books
Books Technology
 Electronics
 Programming
 Web-interface
 Windowed Application
 Video
Video Images
 Audio
Audio Text
Text HTML
HTML Graphical interface
 Lof-files
 Neural networks
 All tags
 Weaponry
 Arduino
 Projects
Graphical interface

When managing a project that involves handling multiple functions, a graphical management interface is essential. While control commands and feedback can be sent and received in their original form, this is only suitable for simpler systems and can be inconvenient for the end user. To make it user-friendly, it is advisable to use a program that can receive data and convert it into a user-friendly format.
This graphical interface offers familiar controls such as fields for entering text and numeric values, sliders, buttons, and switches. To display the system data, you can either use a text interface that presents the data in its raw form or interpret it and display it as graphics or various digital indicators.
Various software can be used to create a graphical interface. A simple option for Windows-based computers is a standard window application written using the .Net framework. This program will be a single executable file and does not require installation. You only need a system with .Net installed, which is available on any PC with the current version of Windows 7/10/11.
The program can connect to the controller via a serial interface or a USB connection with emulation. In this case, the data will be transmitted in text form. The standard connection speed enables the transfer of a considerable amount of data, such as polling sensors 10-20 times per second and transmitting readings to the program. If the connection speed is insufficient, you can carry out pre-processing on the controller side, such as removing noise, and transfer already optimized data. For real-time systems, a serial connection will no longer be enough; more complex methods should be used.
The graphical interface's design will depend on the complexity of the system and the tasks it solves. Digital indicators that display current sensor readings are sufficient for simple measurement systems. The update frequency can be configured so that the end-user sees almost real-time changes in readings. For control, you can add buttons that generate commands and transmit them to the system. For convenience, indicators and control buttons can be formatted into a mnemonic diagram to help the user understand which controls affect which parameters.
To track data changes over time, it is useful to use graphs that show changes in one or more parameters over time and relative to each other. These graphs can be saved and used for further analysis of system operations.
Besides graphs, the graphical interface can work directly with images or even 3D graphics, which is especially useful for controlling various machine tools or 3D printers.
While a mouse and keyboard are the most convenient control devices, the interface can be adapted for touchscreens to use on a mobile phone or placed on the touch control panel directly on the device. In this case, you don't need to connect a separate PC; you can control all functions directly from the control panel.
The graphical interface simplifies system interaction, enabling even inexperienced users to perform necessary actions and understand their results without extensive training and understanding of the system's specifics. Its use is highly desirable wherever possible.
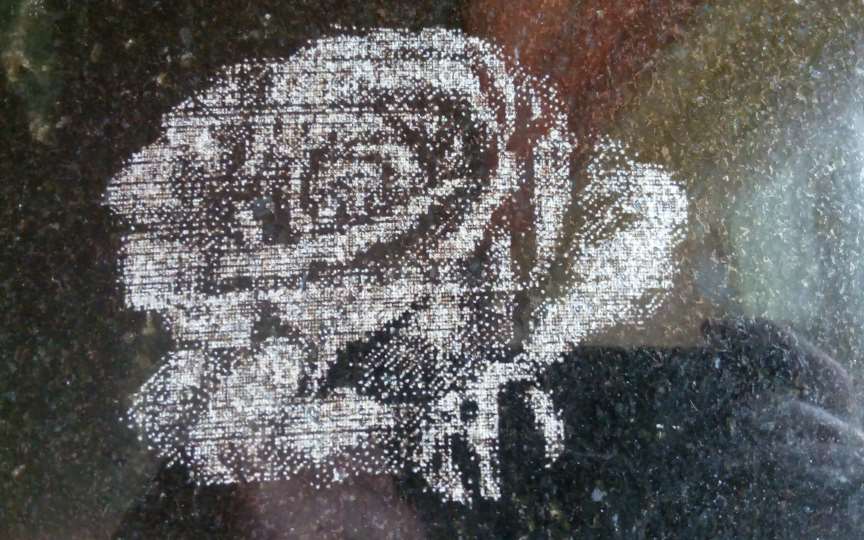
Ultraviolet 3D Printer with table swinging
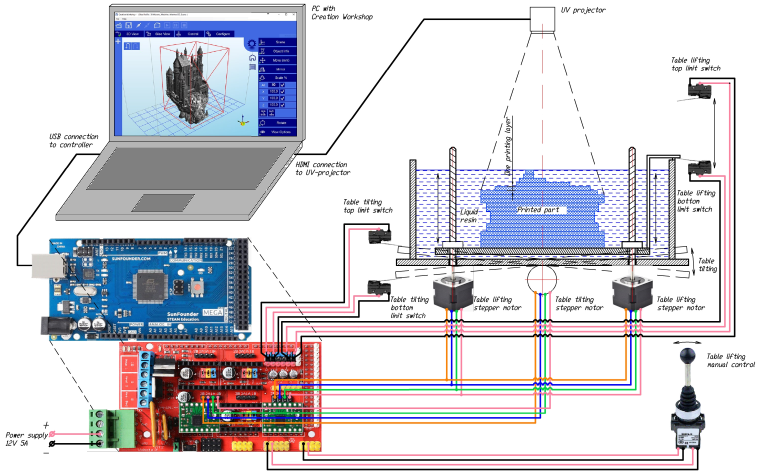
UV curing resin 3D printer with table rocking for better mixing and manual table lift control The part is printed from a liquid resin that hardens under the influence of ultraviolet light. Due to the fact that the thickness of the layers is quite small, after immersion the resin does not always reach the entire surface of the part. To avoid this, use the “Table Rocking” function in between exposures
System for reading an array of analog sensors and display the results matrix
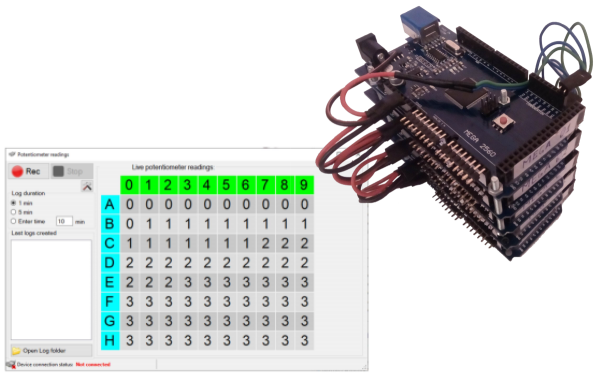
System designed to reading an array of analog sensors and display the results matrix in a convenient form (on a PC screen)
Gyroscopic dynamics measurement system for vehicle
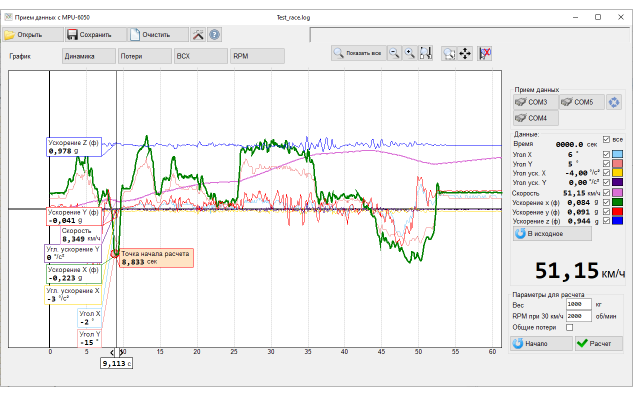
The passive system does not require a connection to the car's on-board computer, it is enough to install it rigidly inside the cabin. After turning on, the system begins to receive data on accelerations and turns in real-time, based on which it generates relative data on movement, turn, speed, and acceleration. Data is transferred to a PC via USB connection (COM-port emulation) and processed by a control application
Mobile platform for testing electric motors
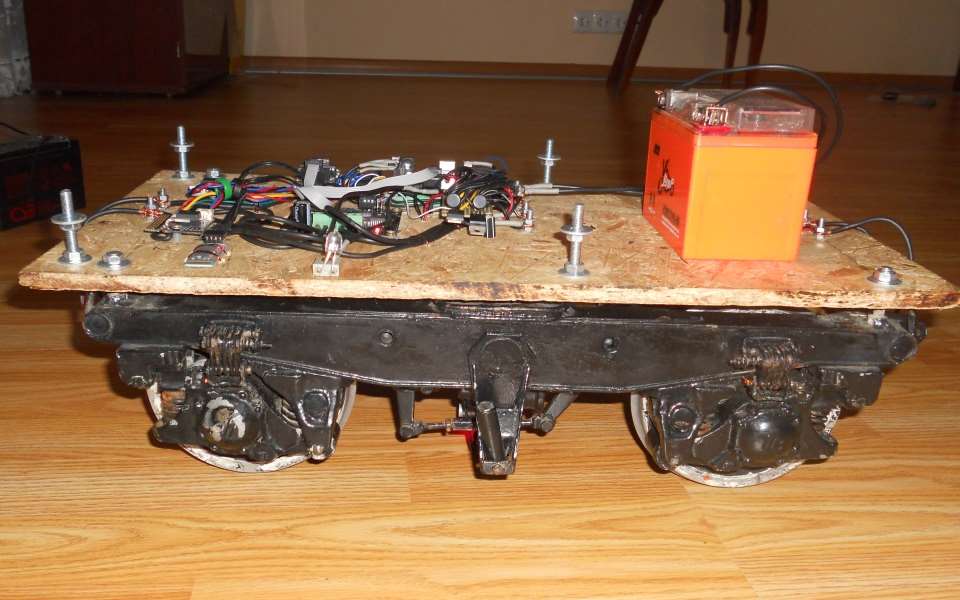
Mobile platform for testing electric motors. Allows you to control the movement of the platform in real time, which moves along the test route and take parameters from the sensors.
Water pumping control system
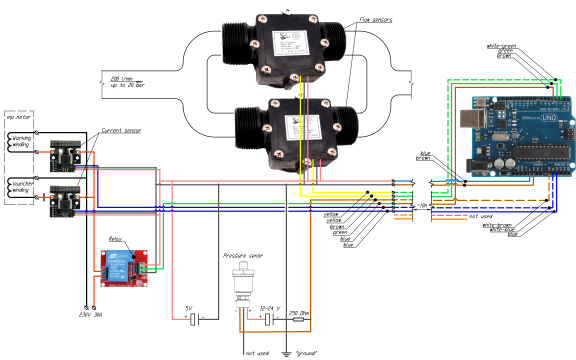
The system for installation on a pipeline for liquids pumping and control of the transportation process. Includes fluid flow sensors, motor current sensor and control relay for online control of process parameters, logging, emergency automatic and manual control of pumping.